View stats for a specific channel
PANDA offers a wide range of stats and analytics to help you understand each channel’s performance, audience, and revenue. (You can also view stats for your entire network.)
From your Channel Dashboard, click Stats from the far-left menu.

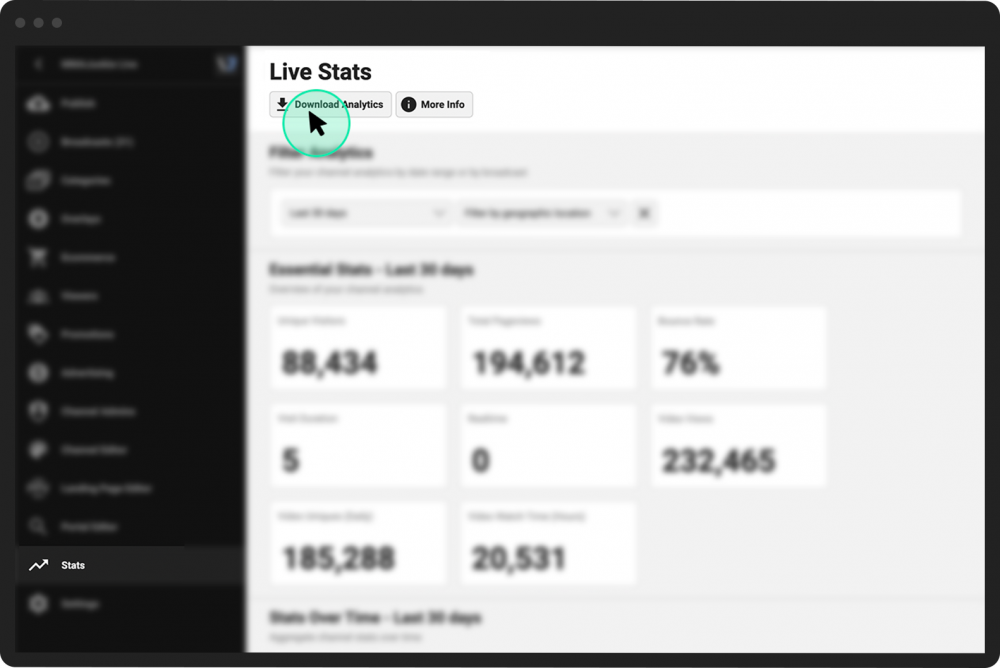
An overview of your channel’s stats is at the top of the page, including unique visitors, total pageviews, bounce rate, visit duration, realtime views, video views, daily unique video views, video watch hours, payments, initial subscriptions, renewals, and revenue.

From here, you can continue scrolling down the page for more detailed stats, or else filter the stats by time period or geographic location.
The channel stats page defaults to stats from the Last 30 Days and all geographic locations. To drill down further:
- 1
From the Filter Analytics section, use the dropdown menus to choose a time period and a specific location.
- 2
The stats page will reload, but this time the stats that appear on the page will be specific to the filters you chose when applicable. The filter will appear in the title of the chart or graph.
- 3
Click the x button to clear your filters and return to overall network stats.


You can view analytics with charts and graphs specific to your channel in a number of areas, including:
Views, Platforms, and Traffic Sources
Visitors, pageviews, bounce rate, and visit duration over time
Video views and unique views
Total watch duration
Most popular pages
Most popular entry and exit pages
Traffic sources with top SEO sources and top SEO referrers
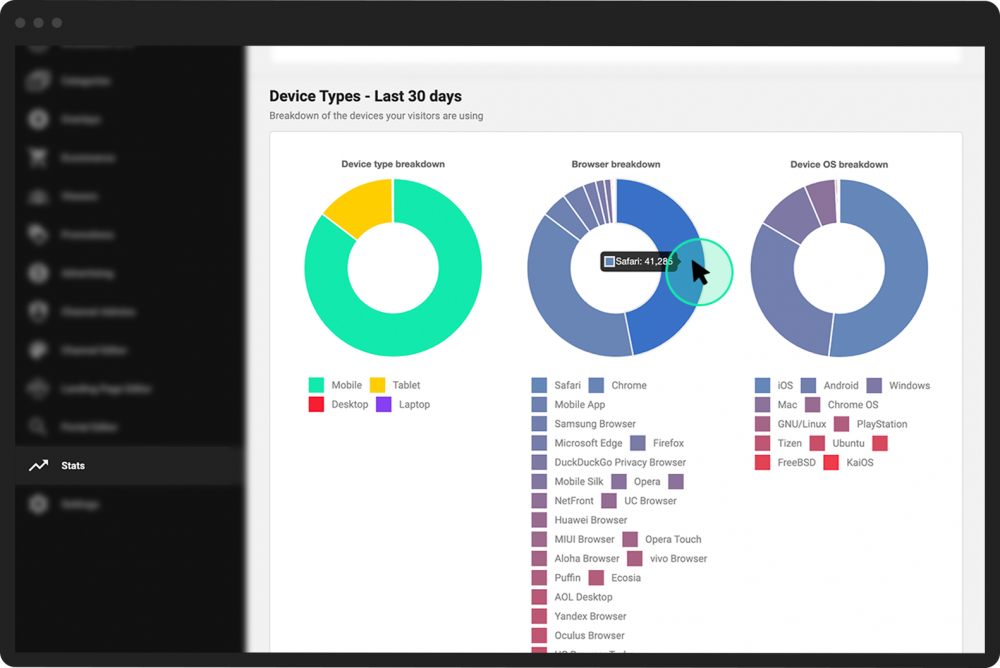
Device, browser, and operating system breakdowns
Daily outbound clicks
Revenue
Revenue fluctuations over time
Payments and payment sources (number of subscription, renewal, or general payments per day/month)
The pie and bar charts on your stats page are interactive. To view the specific number for a slice of a pie chart, hover your mouse over a slice of the chart.
In addition, you can download a document detailing all your network stats. Scroll up to the very top of your stats page and click the Download Analytics button.